


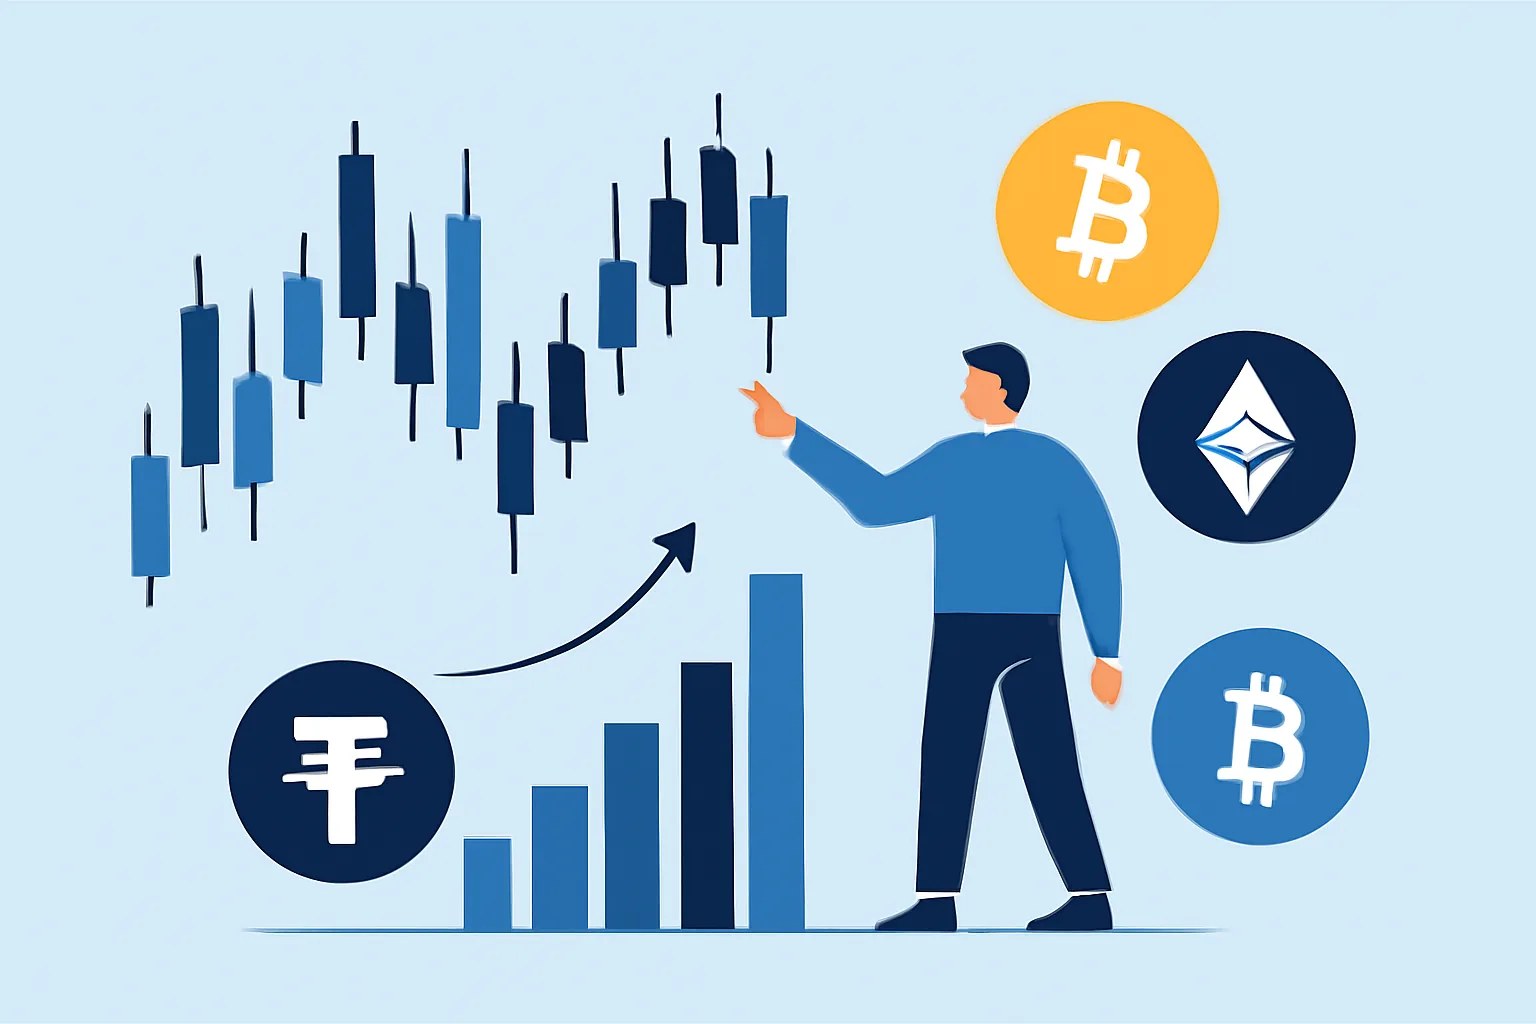
Definition of crypto exchange trading volume
Crypto exchange trading volume is the total amount of a coin or token bought and sold on an exchange during a set period. That period is often 24 hours, though some traders watch 1 hour, 7 days, or a custom session if the exchange offers it. The phrase what crypto exchange trading volume means sounds technical, but the idea is plain: it shows how much actual activity passed through the market.
A volume figure can be measured in units of the asset, in quote currency such as USDT, or in dollar terms. A BTC/USDT pair with 5,000 BTC of volume is telling you something different from a pair with 5,000,000 USDT of volume, even if both numbers look large at first glance. Small detail, big difference.
On a practical level, volume is not a prediction machine. It is a record of trades already executed, and that makes it useful because it is hard to fake a completed trade blotter without leaving other signs. Traders often combine it with price, order book depth, and recent news before making a move.
Why trading volume matters to traders
Volume matters because it usually tells you how easy it may be to enter or exit a trade. A market with strong volume often has tighter spreads and fewer nasty surprises when you click buy or sell. A market with weak volume can look calm right up until your order moves the price against you.
Higher volume also tends to signal stronger interest. If a token suddenly sees a burst of trading on a major venue, traders may read that as new attention from speculators, arbitrage desks, or long-term buyers. That does not mean the move will last. It just means the market is awake.
Liquidity is the word people use here, and volume is one of the easiest clues to liquidity. A thin market can punish a market order with slippage, especially on a fast candle. If you want a broader sense of exchange quality, pairing this topic with how to choose a cryptocurrency exchange can help you separate a busy venue from a usable one.
Here is the catch: high volume can also mean panic. A violent sell-off can create huge numbers and still be a bad sign for holders. Volume alone does not tell you whether the crowd is buying conviction or dumping in a hurry.
How to read volume on an exchange
Most exchange interfaces place volume near the pair name, near the chart, or inside a market list. On many platforms you will see 24-hour volume by default, because it gives a quick snapshot without asking the user to do arithmetic. Some charts also show volume bars below price candles, which is where traders look for confirmation. Learning how to read crypto trading volume starts with knowing where the number appears and what time window it covers.
Timeframe matters. A 5-minute spike can mean a news burst, while a 24-hour increase may show a broader shift in attention. A 7-day trend can smooth out one-off events, but it may also hide a sharp reversal that happened today.
A trader should compare the current volume with the recent average on the same exchange. If the average daily volume on a pair is 10 million and today it is 25 million, something changed. That something might be news, a listing, a market maker adjusting quotes, or just a temporary frenzy.
Volume bars can be read alongside candle shapes. A strong breakout on rising volume often carries more weight than the same breakout on weak volume. One is supported by participation. The other is just a candle doing theater.
If you are still getting used to exchange screens, practical guides such as how to use a crypto exchange can make the layout less confusing, especially if you are moving between spot tabs, derivatives tabs, and chart tools.
Trading volume vs. price movement
Price and volume are related, but they are not the same thing. Price shows where the last trade happened. Volume shows how many trades happened during the period. A token can rise on low volume, and it can fall on high volume. Those two cases tell very different stories. The idea behind crypto exchange volume vs price movement is simple: the two often move together, but not always for the same reason.
When price rises on higher volume, traders often see conviction. That does not guarantee continuation, but it suggests more people were willing to transact at higher levels. When price rises on shrinking volume, the move may be running on fumes. Buyers are still present, yet the crowd is thinner.
Falling prices with high volume can indicate strong selling pressure. Sellers may be rushing out because of bad news, a failed support level, or broad market fear. Falling prices with low volume can mean the market is simply drifting lower without much commitment. Neither pattern is magic. Both need context.
There is also the reverse case: a flat price with heavy volume. That often means a fight is taking place near an important level, with buyers and sellers absorbing each other. Markets do this all day. The chart looks sleepy, but the tape is busy.
Do not make the classic mistake of assuming every big candle is meaningful. A single exchange can show a bright move that disappears when you check a second venue. That is why many traders compare the move across multiple markets before acting, and why exchange reliability matters; resources like keeping investment sites fast, secure are relevant when you depend on live data.
What affects trading volume
News is one of the biggest drivers of trading volume. A new partnership, a regulatory update, a hack, or a major macro event can pull traders into the market within minutes. Crypto reacts quickly because many participants watch the same headlines and the same charts.
Listings can matter too. When a token lands on a larger exchange, new buyers may arrive, arbitrage may increase, and volume can jump sharply. The same can happen during delistings, except the mood is often worse. A forced exit tends to be louder than a quiet entry.
Volatility is another driver. Fast movement draws attention, and attention draws trades. Sometimes the volume comes before the move, as traders position ahead of a catalyst. Sometimes it comes after, when everyone else is chasing the candle. Humans do that.
Market sentiment matters even when no headline seems dramatic. A bullish market can lift volume across many pairs because traders feel comfortable taking risk. A fearful market can also lift volume, but for the opposite reason: people are rushing to reduce exposure, rotate into stablecoins, or hedge.
Trading incentives can inflate activity too. Fee discounts, maker rebates, campaigns, and copy trading promotions can push more orders through the book. That does not always mean organic demand. A venue may look lively because it is paying people to be lively. If you want to inspect incentive-heavy behavior, the discussion of best crypto exchange for copy trading is a useful companion point.
Signs of healthy vs. suspicious volume
Healthy volume usually comes with a visible order book, a steady flow of trades, and price movement that makes some sense relative to the news. The book does not need to be deep on every pair, but it should not look empty on a market claiming huge activity. Real interest tends to leave real footprints.
Suspicious volume often shows up as repeated patterns that look too neat. Identical bursts every few minutes, sudden spikes with no news, or volume that appears only on one venue can all be warning signs. Thin order books are another clue. If the market says it trades millions but the bids and asks look brittle, that mismatch deserves attention.
Wash trading is the classic concern. It happens when trades are matched to create fake activity, making an exchange or a token seem more active than it really is. Traders cannot always prove it from one screenshot, but they can notice odd patterns: flat price, large volume, and almost no spread improvement. That combination should raise eyebrows.
A quick cross-check helps. Compare the same pair on at least 2 exchanges, and see whether the volume and price move together. If one platform reports a surge while the other stays quiet, the surge may be local rather than real. If the exchange publishes reserve data, crypto exchange proof of reserves explained can help you judge how much trust to place in the venue overall.
There is no perfect detector. Still, repeated patterns, isolated spikes, and suspiciously thin books are not random decorations. They are usually clues.
Common mistakes when using volume data
One common mistake is focusing on a single exchange. A token can look active on one venue and quiet everywhere else. That may happen because of regional demand, pair availability, or incentive programs. It can also happen because the exchange is exaggerating its activity.
Another mistake is ignoring timeframe differences. A 1-hour surge can disappear inside a 24-hour average, and a 24-hour number can hide a sudden intraday collapse. Traders who do not check the timeframe often react to the wrong signal. One candle is not the whole story.
Some beginners treat volume as a standalone buy or sell trigger. That is risky. Volume needs price, chart structure, and often a news check before it becomes useful. A breakout on high volume can be promising, but a high-volume dump near resistance can be a trap. Same number, different meaning.
People also forget that low volume can create false chart signals. A support break on a thin market may not matter much if only a few orders pushed it through. Yet the same break on heavy volume can be serious. Context changes the signal.
Another trap is using old data. Crypto volume can change within hours, so a market page from yesterday may already be stale. Before depositing, some traders also review platform mechanics such as crypto exchange withdrawal limits, because volume is useless if you cannot move funds when you need them.
Key takeaways for beginners
The simplest way to use volume is to ask three questions: how much traded, on which timeframe, and alongside what price move. If the answer is “a lot, on the same day, with a clean move and visible participation,” the signal deserves attention. If the answer is vague, slow down.
Volume should be read as evidence, not prophecy. It can confirm a trend, expose a weak move, or warn you that a market is being pushed around. A beginner does not need to predict everything. A beginner needs to avoid obvious traps.
One useful habit is to compare the current market with its recent average and with at least 1 other exchange. If the move is real, the numbers usually rhyme. If the move is fake, the numbers often argue. And if you are still checking projects and venues before putting money in, guides like how to check a crypto exchange can help you ask the right questions before the first trade.
Keep the frame small at first. Watch 24-hour volume, then zoom in on the 1-hour chart, then compare price, and finally ask whether the volume matches the story on the news feed. That four-step habit is enough to avoid many bad reads, especially on markets that look busy only because a few large orders are doing all the work.
If the volume is real, the market usually leaves more than one clue.